
The summer of Love Island
It’s the summer of LOVE. ICYMI, Love Island US and Love Island UK (a reality dating show where participants must couple up in order to succeed) have dominated the content airwaves this summer, thanks in part to a near daily airing schedule for approximately 2 months. With the reunion airing on Monday (8/25), we dusted off the sand from this summers fun and took a look at the data. Both Love Island US and UK have found success over their time on the beach.
That volume strategy extends to social presences, where both shows post at a higher rate than their competitors:
1. Love Island UK – 13.2 Instagram posts per day in season
2. Love Island US – 7.4
3. Love Is Blind – 1.0
4. The Real Housewives Of Atlanta – 0.5
5. Married at First Sight – 0.1
The same is true for YouTube:
1. Love Island UK – 5.3 YouTube posts per day in season
2. Love Island US – 2.1
3. The Real Housewives Of Atlanta – 0.4
4. Love Is Blind – .3
5. Married At First Sight – 0.1
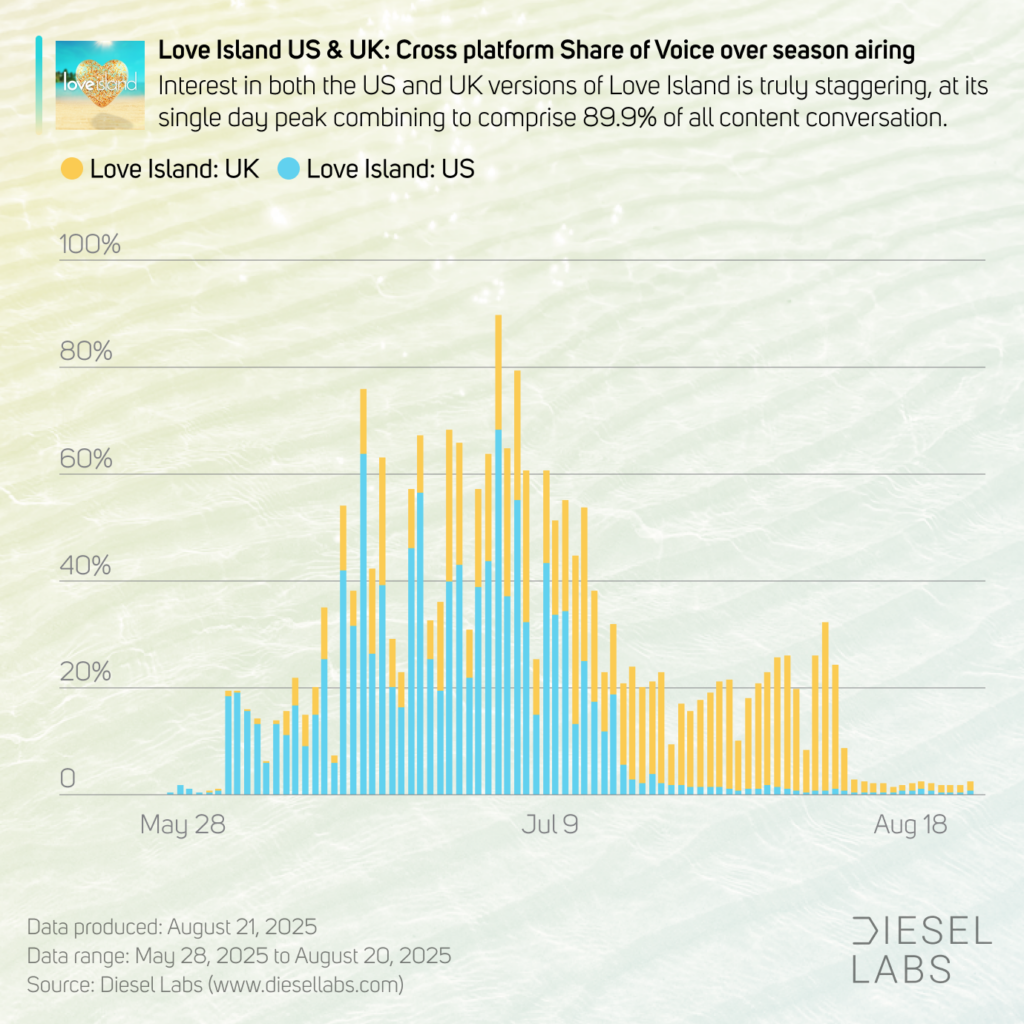
This coordinated effort results in a truly dominant performance. Together the sister shows reached a combined peak of 89.9% in content share of voice on July 1st. Meaning ~90% of all content conversation on that day was about one of the two shows.
A quiet summer likely aided in that performance. Excluding sports & specials, the following movies competed with the 2 LI franchises during their run:
1. KPOP Demon Hunters – 16.0% peak daily SOV
2. Superman – 10.8%
3. Jurassic World Rebirth – 6.3%
4. The Fantastic Four: First Steps – 2.4%
And across television:
1. WWE Monday Night Raw – 18.3% peak daily SOV
2. South Park – 11.8%
3. The Real Housewives of Atlanta – 2.6%
4. SakamotoDays – 2.0%
The fun in the sun isn’t just for the US or UK either. 29 total iterations of the franchise have been produced in 24 different countries over the course of its history. For more news about Love Island and all things reality dating, soak up the sun and hot goss with Diesel Labs!
